Starting Out - Describing the Trade
The Option Risk Calculator allows you to describe an option trade consisting of one or more option positions, and (optionally) a position in the underlying stock.
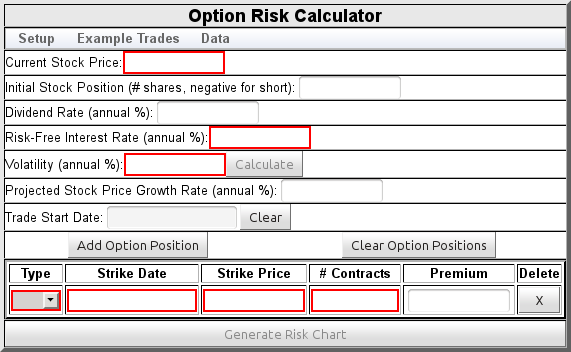
The screen takes the following inputs in the upper section:
- Current Stock Price
- The price of the underlying stock at the start of the trade. This is a required input.
- Initial Stock Position
- If this trade includes a position in the underlying stock (such as for a covered call), indicate the number of shares here. A negative value indicates a short position. Leave empty if the trade has no position in the underlying stock. The price of this stock will be included in the initial trade cost when computing P/L for the trade.
- Dividend Rate
- An annual dividend rate, expressed as a percentage of the stock price. Can be left empty if there are no dividends. This value is interpreted as a continuous dividend, and is commonly published by financial sites as the dividend yield.
- Risk-Free Interest Rate
- The current annual interest rate on risk-free investments. This is a required input.
- Volatility
- The stock's current annual volatility, in percent. This is a required input. You can input a volatility value, or compute an implied volatility from current option prices - more details below.
- Projected Stock Price Growth Rate
- The expected trend in the underlying stock price, expressed as an annual percentage rate: positive if the stock is expected to appreciate, negative if it is expected to go down. All option risk calculators require this information to forecast probabilities, although most reuse the risk-free interest rate rather than accepting it as a separate input. If this field is left empty, the calculator will use the risk-free interest rate.
- Trade Start Date
- The date on which the trade starts. Normally, you would leave this empty - the trade starts today. But you can set a date here to study trades with other starting dates. Click in the text box to bring up a date picker that will let you choose a different start date. Or press the button to remove a date from this field.
Below that is a grid allowing you to specify the individual option positions making up the trade. This area initially contains one emptyrow : use the button to add positions as needed to describe the trade. Each row expects the following inputs:
- Type
- Click in this box to select CALL or PUT. This is a required input.
- Strike Date
- Click in this box to select a strike date. This is a required input. For standard monthly options, select the Saturday after the third Friday of the expiration month.
- Strike Price
- Enter the strike price in this box. This is a required input.
- # Contracts
- Enter the number of contracts: a positive number for a long position, a negative number for a short position. This must be a non-zero value.
- Premium
- Enter the option premium at the start of the trade. If left empty, the calculator will compute the theoretical premium by applying the Black-Scholes pricing model to the stock price, volatility, and risk-free and dividend rates.
Computing Implied Volatility
You can compute the implied volatility for an option position if all other required inputs and a premium value are specified, using the button - see Figure 2.
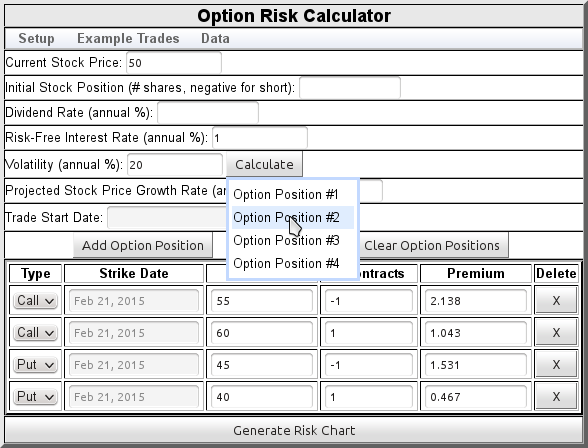
The popup menu will let you choose any of the fully specified option positions - when you choose, the volatility field will be initialized with the computed implied volatility.
Obtaining Stock and Option Data
As you configure trades for analysis, the Option Risk Calculator has the ability to assist by obtaining market data. From the menu, select the menu item. That will bring up this dialog:
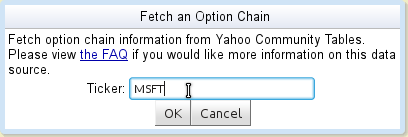
After you click OK, your browser will obtain current market information from Yahoo Community Tables, informing you of its progress as it runs. When done, it puts up a window showing all contracts (weekly, monthly, quarterly, and LEAPs) it retrieved. For each contract, it shows the bid and ask if they were provided:
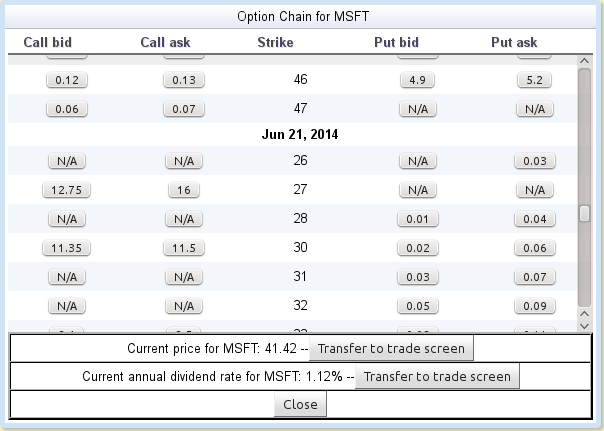
This window contains buttons that let you transfer information to the main trade setup window. Clicking any call bid price button will add a short call position to the trade, at that strike and (if known) premium. Clicking a call ask price will add a long call position to the trade. The put buttons behave similarly for put contracts. The display provides hints to help you understand the buttons:
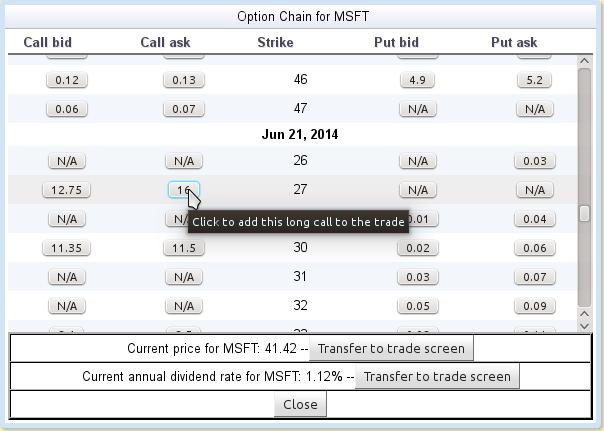
The current stock price and dividend rates are shown at the bottom. Pressing the button next to either will transfer that number to the appropriate field on the main setup screen
Be aware that, when using this capability, you are obtaining data from Yahoo - with no guarantees about the quality or availability of the data. Use this data at your own risk. Please see the FAQ if you would like to learn more about this data source.
When you are done transferring data from this window, you will need to close it to return control to the trade setup window.
Generating the Risk Chart
Once all required fields have been filled in, you can move on to the next step: pressing the button at the bottom to view the risk chart. Note that this button will not be enabled until all required fields have been filled in.
Menus
In addition to the menu, the interface offers the following menus:Setup
This menu contains a button that can be used to clear all fields and remove the current option positions.
Example Trades
The menu offers a collection of example trades. If you select any one of these trades, the input fields will populate with values representing a trade of this type. Note: The values supplied for these examples trades do not represent any real-world securities or options positions - they are fictional numbers meant solely to illustrate the general shape of the trade.
Home • Starting Out • Risk Charts • Outcome Probability Charts • Analyzing the Full Trade • Theory of Operation • Contact Information • Frequently Asked Questions
DISCLAIMER: This risk calculator is for educational purposes only, and is not intended as a basis for trading decisions. Use at your own risk.