Analyzing the Full Trade
In discussing the Outcome Probability Chart, we explored a calendar spread consisting of two options with different expiration dates. And we analyzed the trade up to the first expiration. But what happens then?
To explore that issue, select the → menu choice from the risk chart. Note that this is the most complex capability of the calculator, but one well worth exploring. Lets run a simulation of the full trade...
But first you must describe how the trade works. What happens if the first option expires in the money? Do you settle the position for cash? Accept assignment? End the trade? To study a trade with multiple expirations, you need to simulate what happens at each option expiration. When you choose to run this simulation, the calculator brings up a dialog to configure the trading rules. It allows you to configure the following behaviors:
- Stops - terminating the trade if gains or losses exceed a certain threshold.
- Short position expiration - how to handle expiration of short ITM option positions: accepting assignment, settling for cash, or terminating the trade.
- Long position expiration - how to handle expiration of long ITM option positions: exercising, settling for cash, or terminating the trade.
These rules will be evaluated at each option expiry. We illustrate with some examples below, covering some (but certainly not all) of the trading rules. Figure 14 shows part of the dialog for the calendar spread we've been analyzing:

Let's examine the effect of these trading rules.
First Simulation: Settle Short Option Position for Cash
Let's first run the simulation without setting any rules - so the expiring option position is always settled for cash. Following that practice, here is the projected range of outcomes at expiration of the final option:
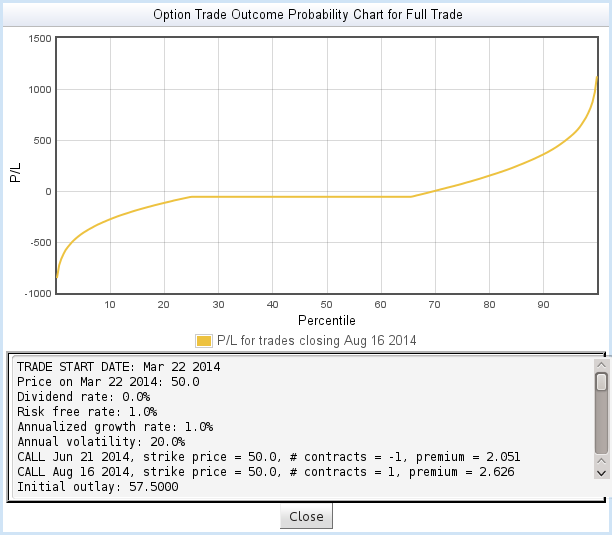
Figure 15 shows the outcome of the full trade, up to the last expiration. What does the curve mean? Notice that it has three parts:
- The left-hand part shows the worst outcomes: the short position expired in the money and was settled for cash, and the long position expired out-of-the-money. There is about a 25% probability of this outcome.
- The middle, flat part of the curve shows the case where both option positions expire out-of-the-money - the net P/L is the debit incurred to set up the position. There is about a 40% probability of ending on this part of the curve.
- The right part of the curve shows the best outcomes, where the short position expired out-of-the-money and the long position expired in-the-money. There is about a 35% probability of landing on this part of the curve.
(These explanations are somewhat simplified. The simulated trades will inevitably include cases with price swings in which both option positions end up in-the-money. While they don't stand out in any obvious visual way, those cases are also included in this curve.)
One thing we learn from this curve is that we're using terrible trading rules. Allowing the short position to close deeply in-the-money, then settling for cash, creates too many poor outcomes. Let's explore some better trading rules.
Second Simulation: Accept Assignment
For the second simulation, we change the trading rules to accept assignment under certain circumstances:
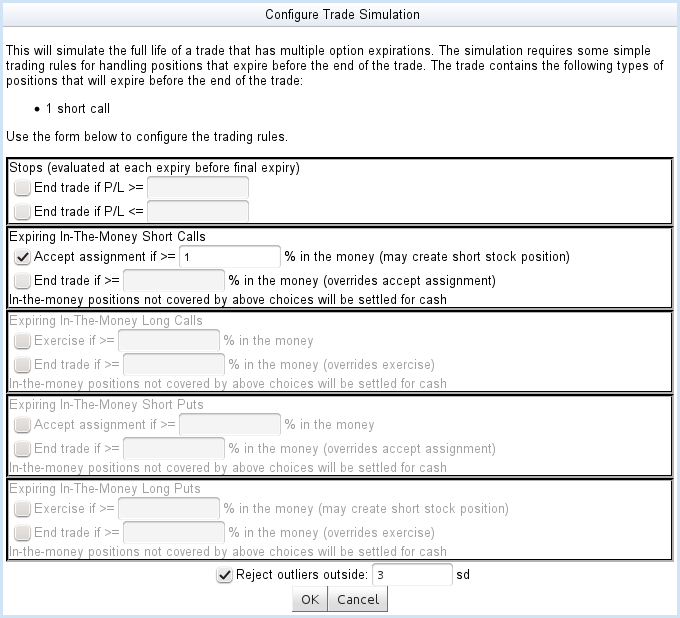
Using the new trading rules in Figure 16, we will accept assignment (creating a short stock position) if the short call expires more than 1% in-the-money. Otherwise, the position will be settled for cash. Here is the resulting Outcome Probability Chart:
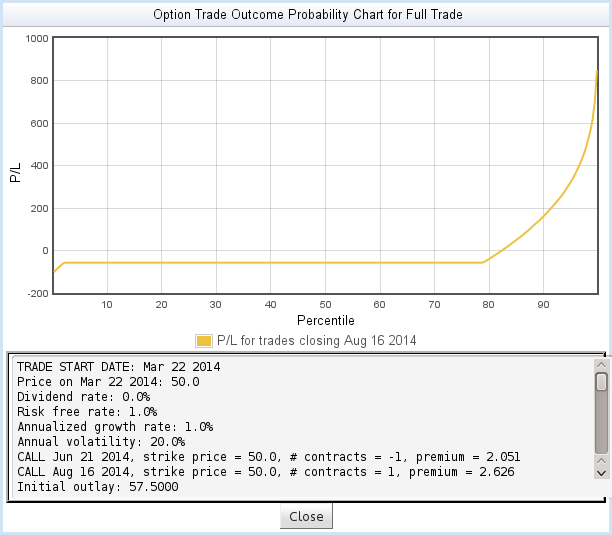
The trade in Figure 17 is obviously very different. Here is another simplified (but reasonably accurate) interpretation of the curve:
- The small tail at the left represents the cases in which the short position expires in-the-money and is settled for cash.
- The long flat region represents the aggregate result of two
different cases:
- As before, both option positions expire out-of-the-money, resulting in a net loss of the debit incurred to set up the trade.
- The short option position expired > 1% in-the-money, so the trade took on a short stock position when the option was assigned. Any gain or loss in the stock position is balanced out by opposite movement in the long option position, resulting in no net movement beyond the debit incurred to set up the trade.
- Finally, the curve on the right represents the most profitable outcomes: the short option position was assigned, the stock plunged, and the short stock position paid off - with potentially unlimited upside.
Third Simulation: Closing the Trade Early
Finally, one more case to study. Let's consider closing the trade early if the short position expires in-the-money:
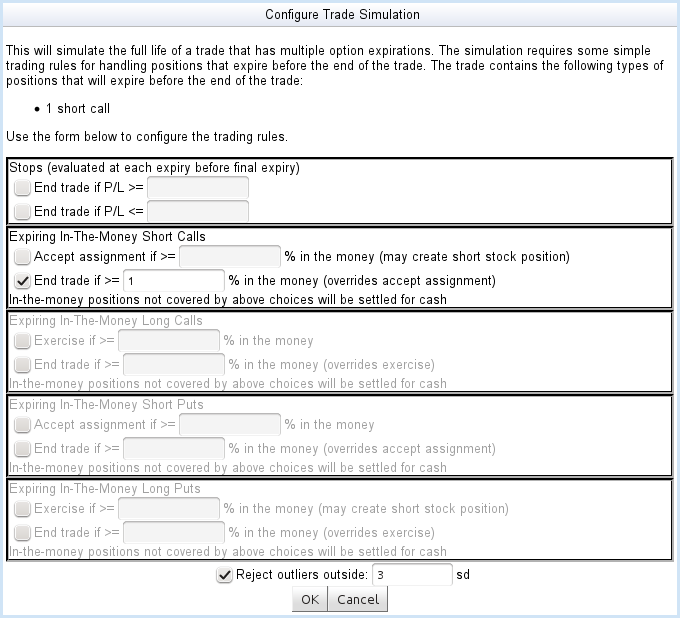
Figure 18 describes another strategy for calendar spreads: closing the trade early if the short position fares poorly. This is now a more complex trade to understand, because it has more than one potential ending date. The resulting Outcome Probability Chart describes the various possible outcomes:
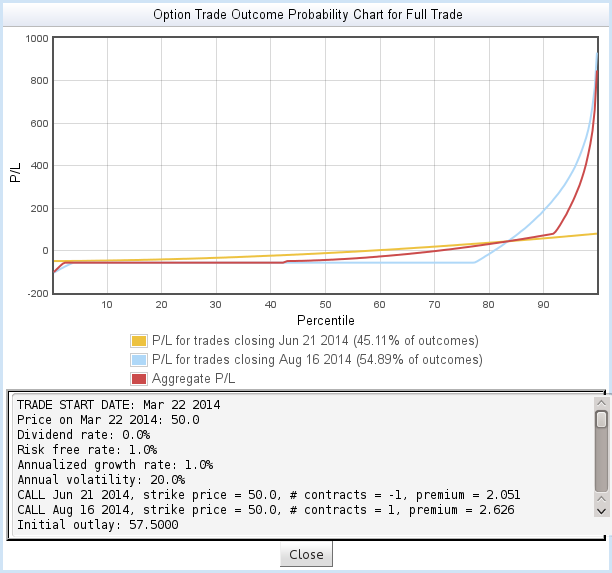
This chart is more crowded than the earlier examples, but conveys the same information. There are three curves:
- The yellow curve describes the trades that close early because the short position expires > 1% in-the-money. As the chart legend shows, this will occur about 45% of the time. Notice that this result breaks even at about the 58th percentile - it has about a 42% chance of being profitable.
- The blue curve describes the 55% of the cases that close at the final expiry. Notice that the majority of these cases - about 78% - end with the long position expiring out-of-the-money. This is not surprising, since most of these simulated trades were out-of-the-money at the time the short position expired.
- The red curve is an aggregate, reporting the resulting P/L over all simulated trades: the net effect of using these trading rules. This curve allows you to evaluate the overall probability of success.
The scrolled text area contains details about all three of these curves, allowing you to study their breakeven points and average returns.
Exercise: Closing at a Profitable First Expiry
The last simulation is left as an exercise. A common goal of a calendar spread is to close the trade at the first expiry if the price stays near the strike. The trading rules allow you to set a trigger price - a minimum P/L - for closing the trade. By combining this with some of the rules discussed above, you can design a calendar spread that harvests a profit (if it's adequate) at the first expiry, cuts losses when appropriate, and otherwise runs out to the final expiry.How Well Does This Describe Actual Trades?
This simulation is obviously extremely limited. It does not model early exercise or assignment, rolling of option positions, opening of new positions during the trade, or any action that might take place on non-expiry dates. This means for example, that it cannot model a diagonal spread. Nevertheless, it provides an opportunity to explore what strategies might be useful in designing trades with multiple expirations.
What is this Simulation Actually Doing?
Please read the Theory of Operation for more detail about the math behind the option risk calculator.
Home • Starting Out • Risk Charts • Outcome Probability Charts • Analyzing the Full Trade • Theory of Operation • Contact Information • Frequently Asked Questions
DISCLAIMER: This risk calculator is for educational purposes only, and is not intended as a basis for trading decisions. Use at your own risk.