The Option Risk Calculator Risk Chart
After you set up the trade and generate the risk chart, the calculator will display a risk chart for the trade as of the first expiration date.
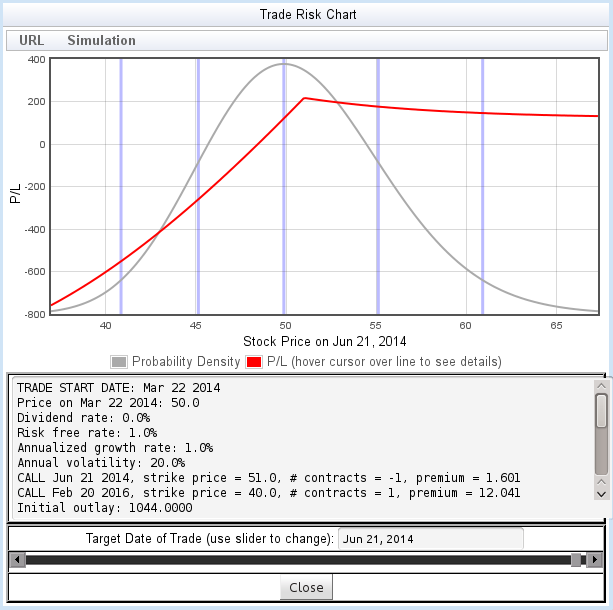
The chart shows two plots:
- A probability density plot (in grey) showing the distribution of expected prices, based on the current price, the volatility, and the expected rate of growth. The light-violet vertical lines mark the -2σ, -1σ, mean, 1σ, and 2σ points on the lognormal distribution.
- A profit/loss plot (in red), showing the P/L of the trade at various stock price values.
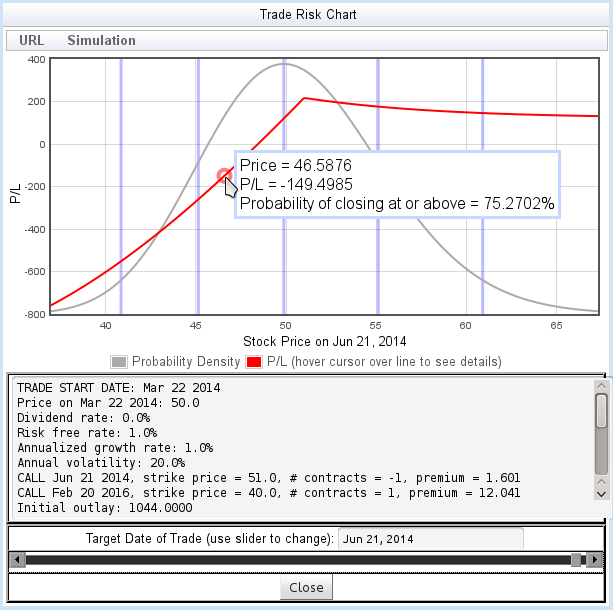
As you move the mouse over the red plot, a flyover window will show some statistics about the value and probability of the trade at the cursor position:
Below the chart is a scrolled text area describing the trade and some statistics from the computation
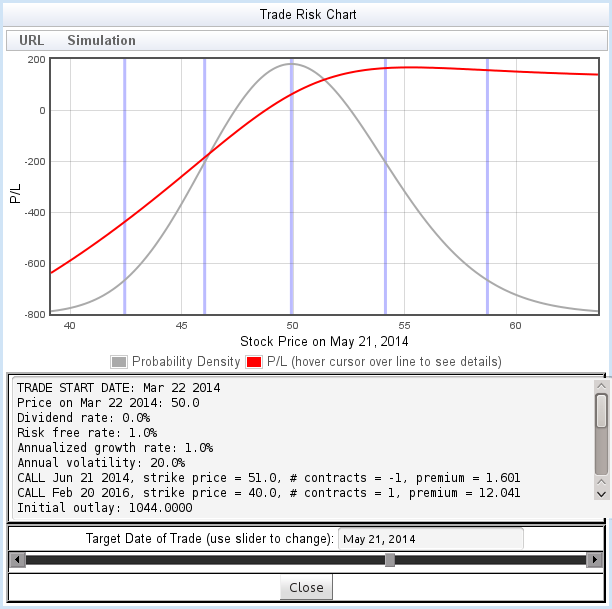
At the bottom of the window is a scrollbar that lets you view the value of the trade before its expiration. By moving the scrollbar, you can choose any date between tomorrow and the expiration (figure 8). This allows you to view the probability distribution and the effect of the option's time value throughout the life of the trade.
Further Analyzing the Trade
The Option Risk Calculator functionality described so far is conventional - many brokerages offer similar online tools. Risk charts have limitations, however: while it's easy enough to understand the profit and loss as a function of price, these charts do a poor job of conveying the likelihood of various P/L outcomes. Also, risk charts are useless for analyzing a trade with multiple expirys once you pass the first expiry: the composition of the trade changes, and risk charts do not lend themselves to representing trades with multiple phases.
To address these weaknesses, the Option Risk Calculator offers an alternate view of a trade, based on Monte Carlo simulation methods. This new view is called the Outcome Probability Chart.
To generate the Outcome Probability Chart, use the menu. The menu will offer one or two types of analysis:
- Simple Trade Outcome Simulation: Run a simulation of the trade, up to the first option expiration.
- Simulate Complete Trade: If the trade contains multiple option expiration dates, you can simulate the entire life of the trade up to the final expiration. This menu item is only enabled if the trade contains multiple option expiration dates.
To learn more, visit the documentation for the Outcome Probability Chart.
Menus
In addition to the menu, this window offers the following features through menus:
- →
- Generates a URL that will show a the chart and trade description, without the full interactive interface. The page includes a button allowing the user to launch the full interface.
- →
- Generates a URL that will launch the Option Risk tool, and a view of the chart in its current configuration (exactly what you see before generating the URL). This allows you to share information and analysis of the trade with other users.
Home • Starting Out • Risk Charts • Outcome Probability Charts • Analyzing the Full Trade • Theory of Operation • Contact Information • Frequently Asked Questions
DISCLAIMER: This risk calculator is for educational purposes only, and is not intended as a basis for trading decisions. Use at your own risk.